
Spend Analytics: A Deep Dive for Friday
Introduction - Hook with real problem
Imagine this: You're the CFO of a mid-sized manufacturing company. You've been tasked with cutting costs by 15% across the board. You've already squeezed the obvious operational efficiencies. Now, you're staring at your spend data, a mountain of invoices, purchase orders, and expense reports. You know there are savings to be found, but sifting through the noise feels like searching for a needle in a haystack. The spreadsheets are unwieldy, the categories are inconsistent, and the insights are buried beneath layers of manual effort. You need spend analytics, but the promises of "AI-powered insights" from vendors last year didn't deliver. In 2026, what actually works? What strategies, technologies, and approaches will truly unlock hidden savings and drive strategic procurement? This is the problem we'll tackle, moving beyond buzzwords to provide actionable insights for spend analytics that deliver real results.
The Current Landscape - What's happening in 2026
In 2026, the spend analytics landscape is defined by several key trends:
* Hyper-Personalization: Generic dashboards are out. Customized analytics, tailored to specific roles and departments, are the norm. Think "marketing spend effectiveness dashboard" versus a general "overall spend" view.
* Predictive Analytics & Scenario Planning: Moving beyond descriptive and diagnostic analytics, businesses are leveraging AI to predict future spend patterns, identify potential risks (e.g., supplier bankruptcies), and model the impact of different sourcing strategies.
* Embedded Analytics: Spend analytics is no longer a separate system. It's integrated directly into ERP, CRM, and procurement platforms, providing real-time insights within the workflows where decisions are made.
* Sustainability & ESG Integration: Spend data is being used to track and improve environmental, social, and governance (ESG) performance across the supply chain. This includes monitoring supplier diversity, carbon emissions, and ethical sourcing practices.
* Rise of Decentralized Analytics: While centralized spend management remains important, individual business units and departments are empowered with self-service analytics tools to identify opportunities and optimize their own spending.
* Data Security and Privacy: Heightened regulations and customer expectations are driving a focus on data security and privacy in spend analytics, particularly when dealing with sensitive supplier or employee information.
* The Talent Gap: While technology has advanced, the skills to effectively analyze and interpret spend data remain in short supply. Investing in training and upskilling is crucial.
Deep Dive: Core Concepts - Frameworks and analysis
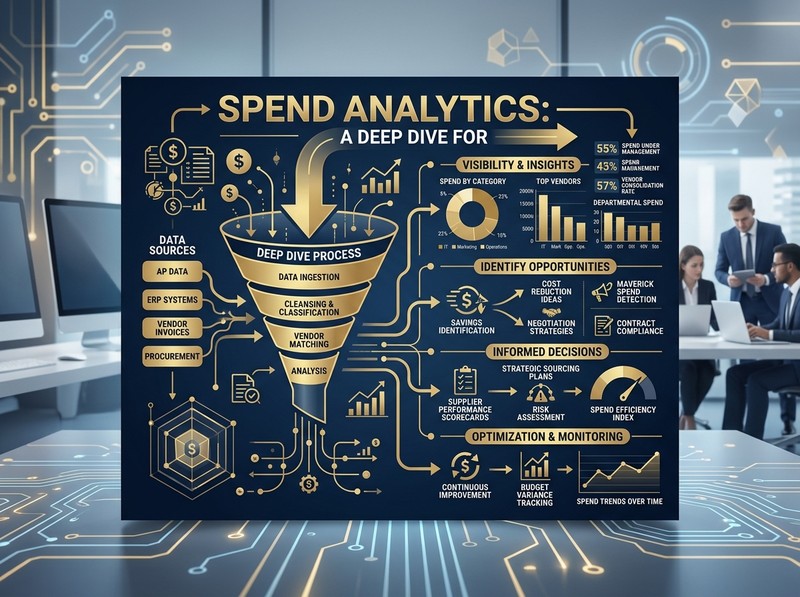
Effective spend analytics in 2026 goes beyond simply categorizing spend. It requires a structured approach built on several core concepts:
* Spend Cube (Multi-Dimensional Analysis): Think beyond simple supplier/category/amount views. A spend cube allows you to slice and dice your data across multiple dimensions simultaneously (e.g., supplier, category, region, business unit, time period, contract terms). This enables more granular and insightful analysis.
* Supplier Segmentation & Risk Assessment: Classifying suppliers based on their strategic importance, risk profile, and performance is critical. This allows you to prioritize your efforts and focus on the suppliers that matter most. Frameworks like Kraljic's Portfolio Purchasing Model (non-critical, leverage, bottleneck, strategic) are still relevant but need to be adapted to incorporate modern risk factors (e.g., cybersecurity, geopolitical instability).
* Category Management: Organizing spend into logical categories (e.g., IT, marketing, facilities) and developing category-specific strategies is essential for driving savings and improving supplier relationships. Effective category management requires a deep understanding of market dynamics, supplier capabilities, and internal needs.
* Contract Compliance Analysis: Ensuring that suppliers are adhering to the terms of their contracts is a crucial aspect of spend analytics. This includes monitoring pricing, service levels, and payment terms. Automated contract analysis tools are becoming increasingly sophisticated, leveraging AI to identify potential violations and opportunities for renegotiation.
* TCO (Total Cost of Ownership) Analysis: Evaluating the total cost of a product or service, including all direct and indirect costs, is essential for making informed sourcing decisions. This requires gathering data from multiple sources (e.g., invoices, maintenance records, energy consumption data) and using sophisticated modeling techniques.
Comparison and Trade-offs - Tables with pros/cons
Let's look at some key decisions and their trade-offs:
Table 1: Spend Analytics Platform Deployment Options
| Option | Pros | Cons | Best For |
| ------------------- | ------------------------------------------------------------------------------------------------------- | ---------------------------------------------------------------------------------------------------------- | -------------------------------------------------------------------------------------------------------------- |
| Cloud-Based SaaS | Scalable, easy to deploy, lower upfront costs, automatic updates. | Data security concerns, vendor lock-in, reliance on internet connectivity. | Most organizations, especially those with limited IT resources. |
| On-Premise | Greater control over data security, customization options, integration with existing legacy systems. | Higher upfront costs, requires dedicated IT resources, slower deployment. | Organizations with strict data security requirements or complex integration needs. |
| Hybrid | Balance between control and scalability, allows for gradual migration to the cloud. | Complexity of managing both on-premise and cloud environments, potential integration challenges. | Organizations that want to retain some control over their data while leveraging the benefits of the cloud. |
Table 2: Data Cleansing Approaches
| Approach | Pros | Cons | Best For |
| ------------------- | ------------------------------------------------------------------------------------------------ | ----------------------------------------------------------------------------------------------- | -------------------------------------------------------------------------------------------------------------- |
| Manual Cleansing | High accuracy, allows for contextual understanding, good for small datasets. | Time-consuming, prone to errors, not scalable. | Small organizations with limited spend data or specialized categories requiring expert knowledge. |
| Automated Cleansing| Scalable, fast, reduces manual effort. | Requires careful configuration, may not be accurate for all data types, potential for "garbage in, garbage out." | Organizations with large datasets and standardized data formats. |
| Hybrid Approach | Combines the best of both worlds, leverages automation for efficiency and manual review for accuracy. | Requires careful planning and coordination, can be more expensive than a purely automated approach. | Most organizations, especially those with complex and varied data sources. |
Implementation Framework - Step-by-step guide
Implementing a successful spend analytics program in 2026 requires a structured approach:
1. Define Objectives & Scope: Clearly define the goals of your spend analytics program (e.g., cost reduction, supplier risk management, ESG compliance). Determine the scope of the analysis (e.g., all spend, specific categories, specific regions).
2. Data Acquisition & Integration: Identify all relevant data sources (e.g., ERP, AP systems, procurement platforms, expense reports). Develop a plan for extracting, transforming, and loading (ETL) data into a central repository. Consider using data integration tools to automate this process.
3. Data Cleansing & Enrichment: Cleanse and standardize your data to ensure accuracy and consistency. This includes removing duplicates, correcting errors, and standardizing supplier names and categories. Enrich your data with external sources (e.g., supplier risk ratings, industry benchmarks).
4. Category Taxonomy Development: Develop a clear and consistent category taxonomy that aligns with your business needs. This will enable you to effectively track and analyze spend across different categories.
5. Analysis & Reporting: Use spend analytics tools to analyze your data and identify opportunities for savings and improvement. Create customized reports and dashboards to track key performance indicators (KPIs).
6. Action Planning & Implementation: Develop action plans to address the opportunities identified through spend analytics. This may include negotiating better pricing with suppliers, consolidating spend, or improving contract compliance.
7. Monitoring & Continuous Improvement: Continuously monitor your spend data and track the results of your action plans. Use this information to refine your spend analytics program and identify new opportunities for improvement.

Decision Guide - How to choose
Choosing the right spend analytics solution and approach requires careful consideration of your organization's specific needs and resources. Here's a decision framework:
* Business Needs: What are your primary goals for spend analytics? (Cost reduction, risk management, ESG compliance, etc.)
* Data Maturity: How clean and consistent is your spend data? Do you have a well-defined category taxonomy?
* Technical Capabilities: Do you have the IT resources and expertise to deploy and manage a spend analytics solution?
* Budget: How much are you willing to invest in spend analytics?
* Organizational Culture: Is your organization data-driven? Are your stakeholders willing to embrace new technologies and processes?
Based on these factors, you can prioritize the following criteria when evaluating spend analytics solutions:
* Functionality: Does the solution offer the features and capabilities you need? (e.g., spend cube analysis, supplier segmentation, contract compliance analysis)
* Usability: Is the solution easy to use and understand? Can your stakeholders easily access and interpret the data?
* Scalability: Can the solution scale to meet your growing data volumes and user base?
* Integration: Does the solution integrate seamlessly with your existing systems?
* Vendor Support: Does the vendor offer adequate training and support?
Case Study or Real Example
Let's consider a real-world example: A large hospital network was struggling to control its medical supply costs. They implemented a spend analytics solution that integrated data from their ERP system, purchase order system, and inventory management system. The solution identified significant price variations across different hospitals within the network for the same medical supplies. By consolidating their purchasing power and negotiating better pricing with suppliers, the hospital network was able to reduce its medical supply costs by 18% within the first year. Furthermore, the analytics revealed significant off-contract spending. By implementing better procurement policies and directing spend to preferred suppliers, they achieved an additional 5% savings. The key takeaway is that identifying and addressing both price variance and off-contract spend can yield substantial cost savings.
30-Day Action Checklist
Here's a practical checklist to get you started with spend analytics in the next 30 days:
* Week 1:
* Define your top 3 spend analytics goals (e.g., reduce maverick spend, improve supplier payment terms, identify duplicate invoices).
* Identify your key data sources (ERP, AP, Procurement).
* Assign a project lead and assemble a small cross-functional team.
* Week 2:
* Extract a sample dataset from your primary data source.
* Assess the quality of your data (identify missing values, inconsistencies, errors).
* Start building a basic category taxonomy.
* Week 3:
* Research and evaluate potential spend analytics solutions (focus on your defined goals).
* Schedule demos with 2-3 vendors.
* Develop a preliminary budget.
* Week 4:
* Select a spend analytics solution or decide on an initial approach (e.g., using existing BI tools).
* Develop a detailed implementation plan.
* Communicate your plans to key stakeholders.
Bottom Line - Key takeaways
Spend analytics in 2026 is about more than just technology. It's about having a clear strategy, a robust data foundation, and a commitment to continuous improvement. Key takeaways:
* Focus on Actionable Insights: Don't get bogged down in data for data's sake. Prioritize insights that can drive real business value.
* Embrace Automation: Leverage AI and machine learning to automate repetitive tasks and identify hidden opportunities.
* Empower Your Stakeholders: Provide self-service analytics tools that enable users to access and analyze spend data on their own.
* Don't Neglect Data Quality: Invest in data cleansing and enrichment to ensure the accuracy and reliability of your analysis.
* Continuously Monitor and Improve: Regularly review your spend analytics program and make adjustments as needed.
Work With Versalence - CTA paragraph
Ready to unlock the full potential of your spend data? Versalence provides AI-powered spend analytics solutions tailored to your specific business needs. We help you identify hidden savings, optimize supplier relationships, and improve your bottom line. Contact us today for a free consultation. Let us help you transform your spend data into a strategic asset.
📧 versalence.ai/contact.html | sales@versalence.ai